Visual Data Report- PowerBI
26
0
تحليل البيانات - الإثنين 17 نوفمبر 2025 17:28
1 / 3
تفاصيل الخدمة
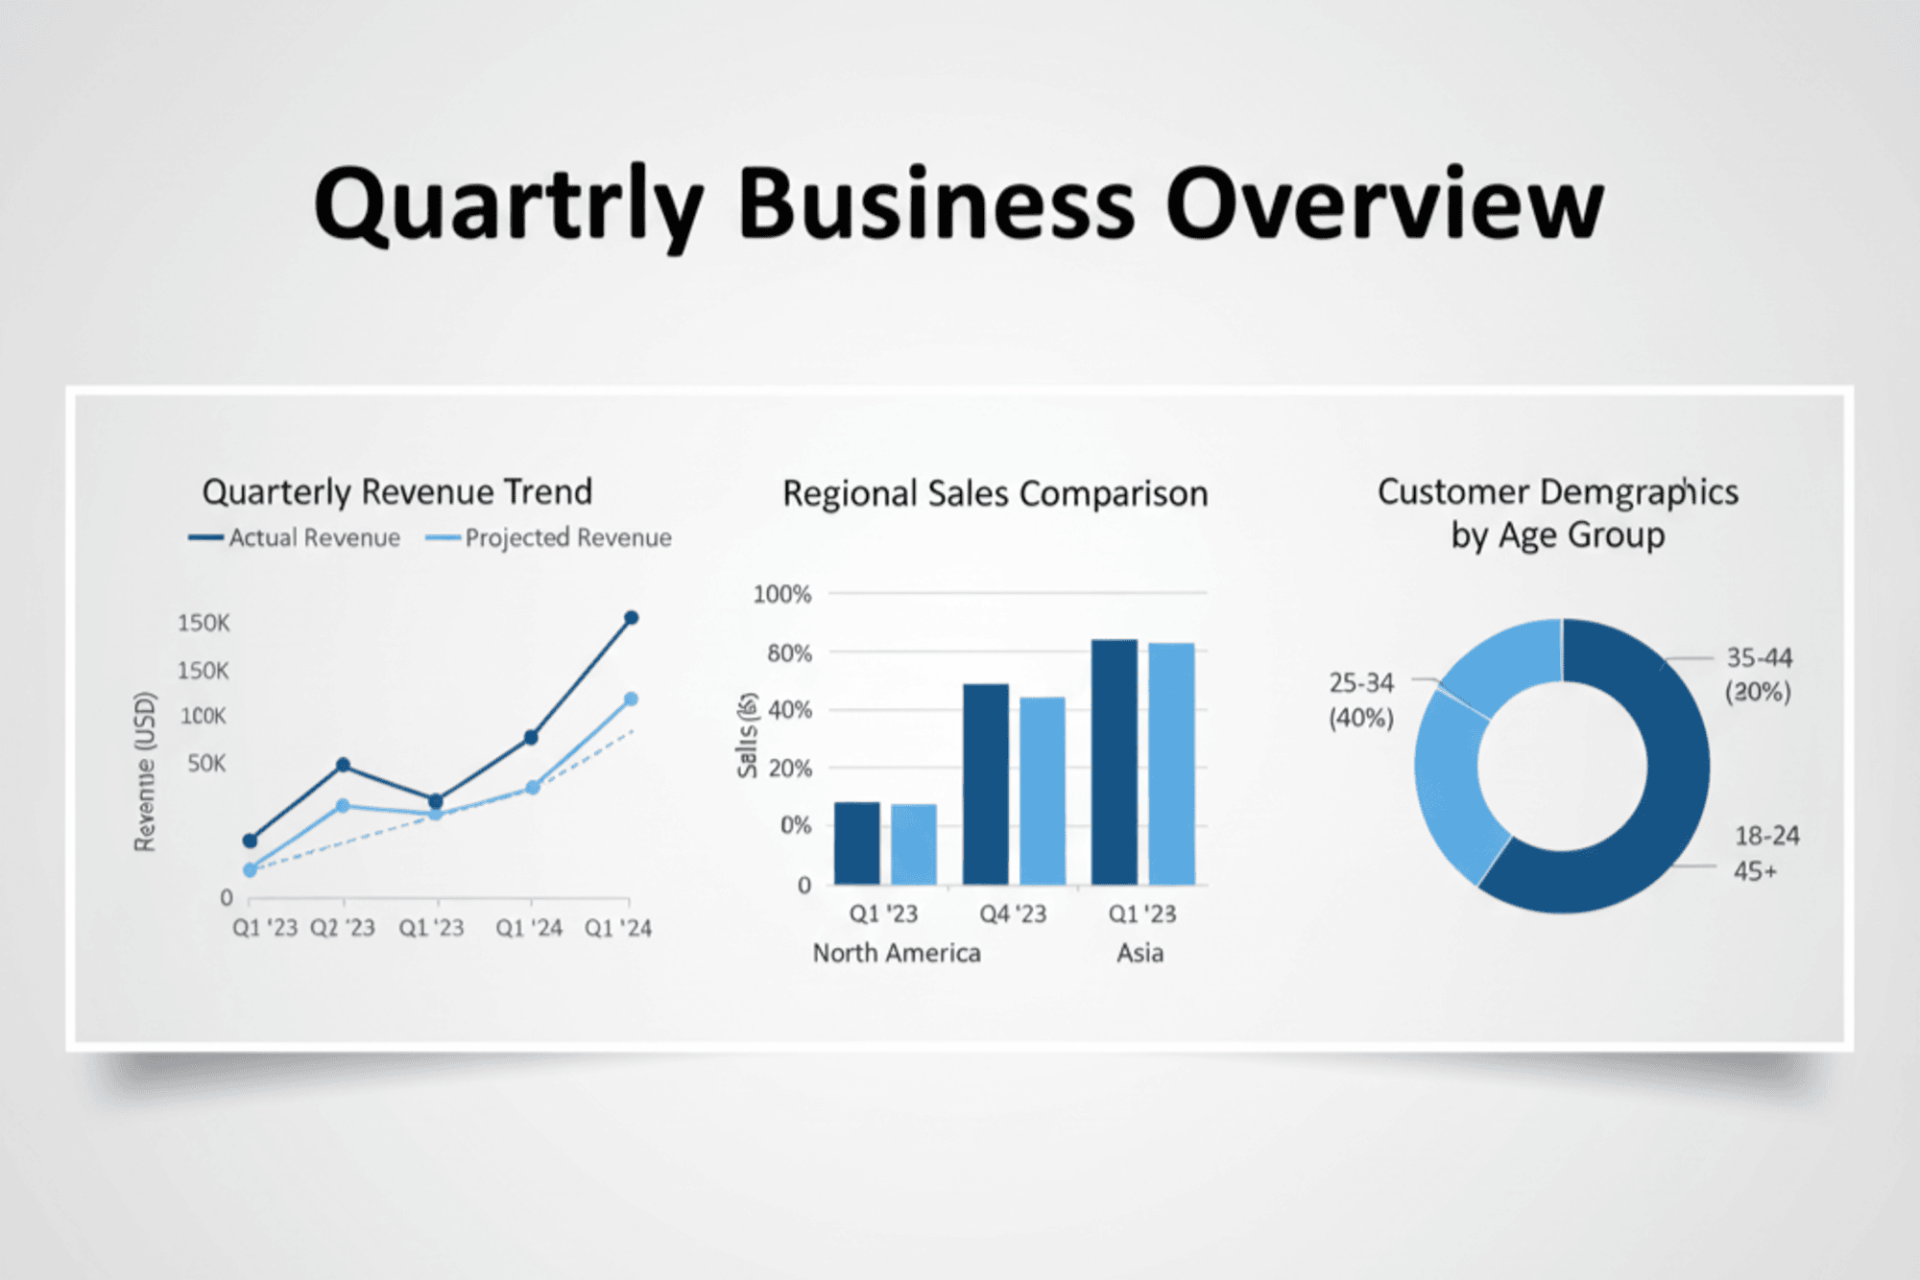
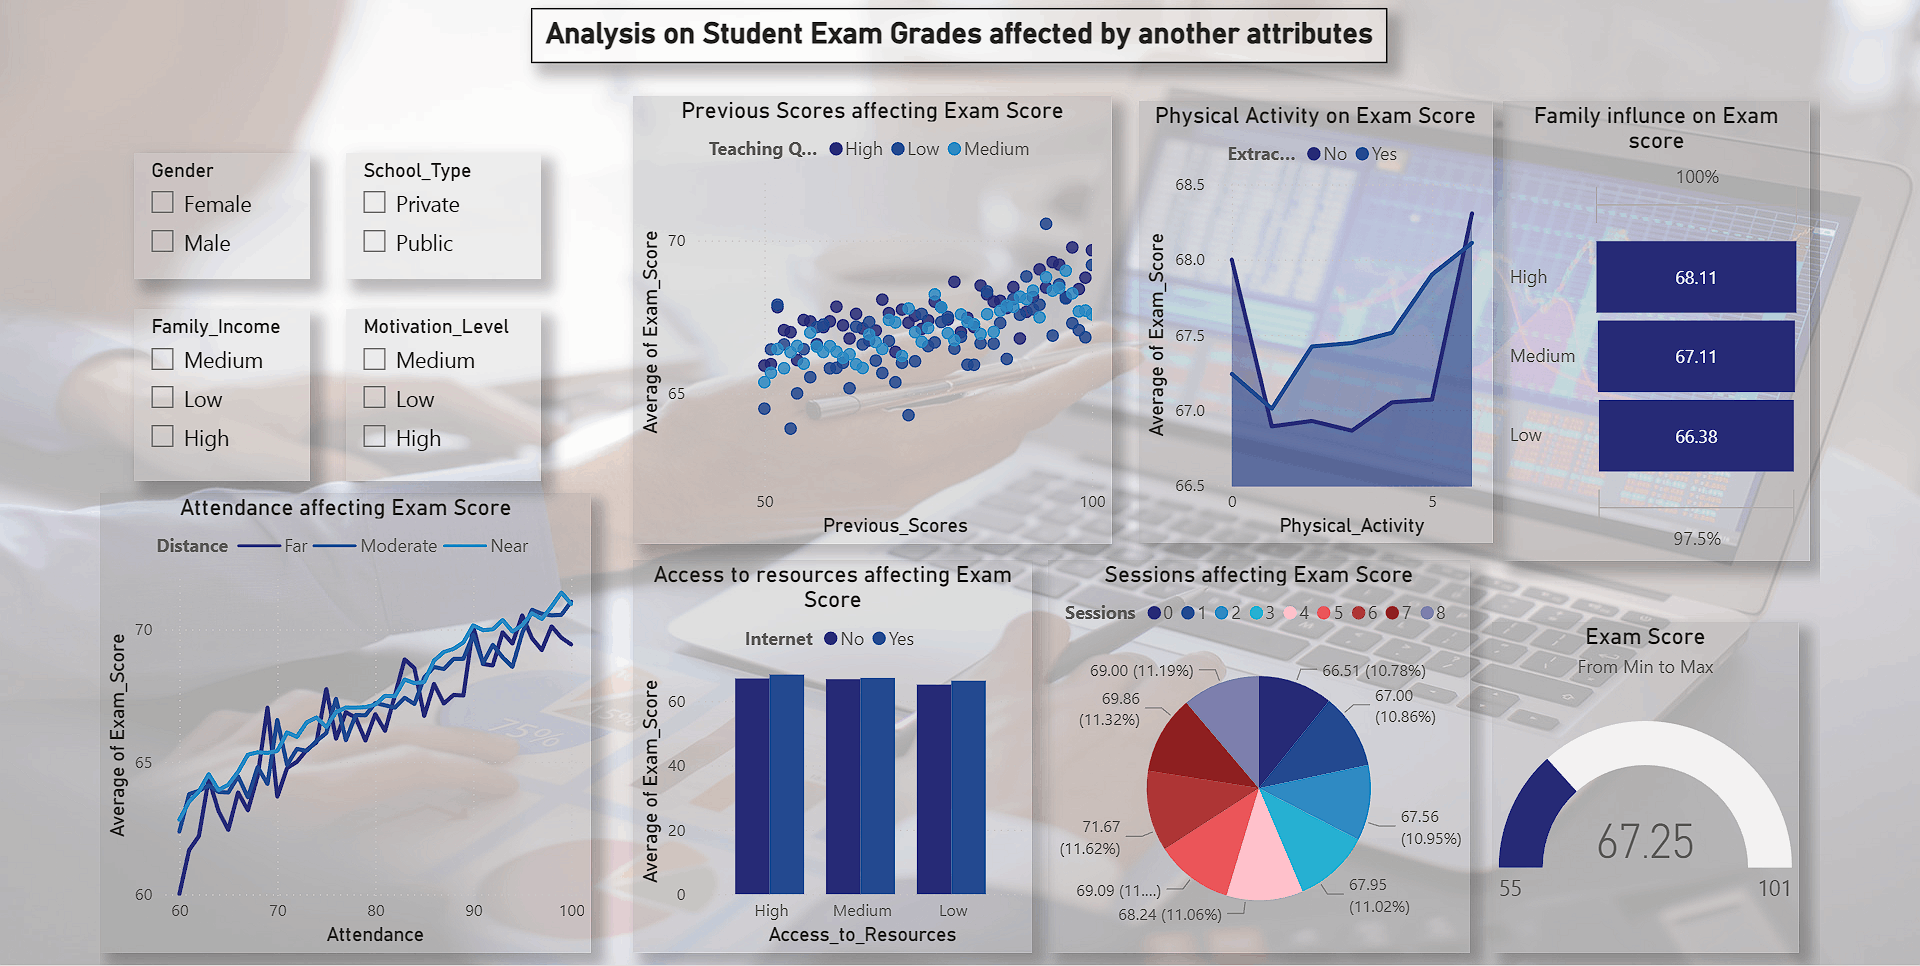
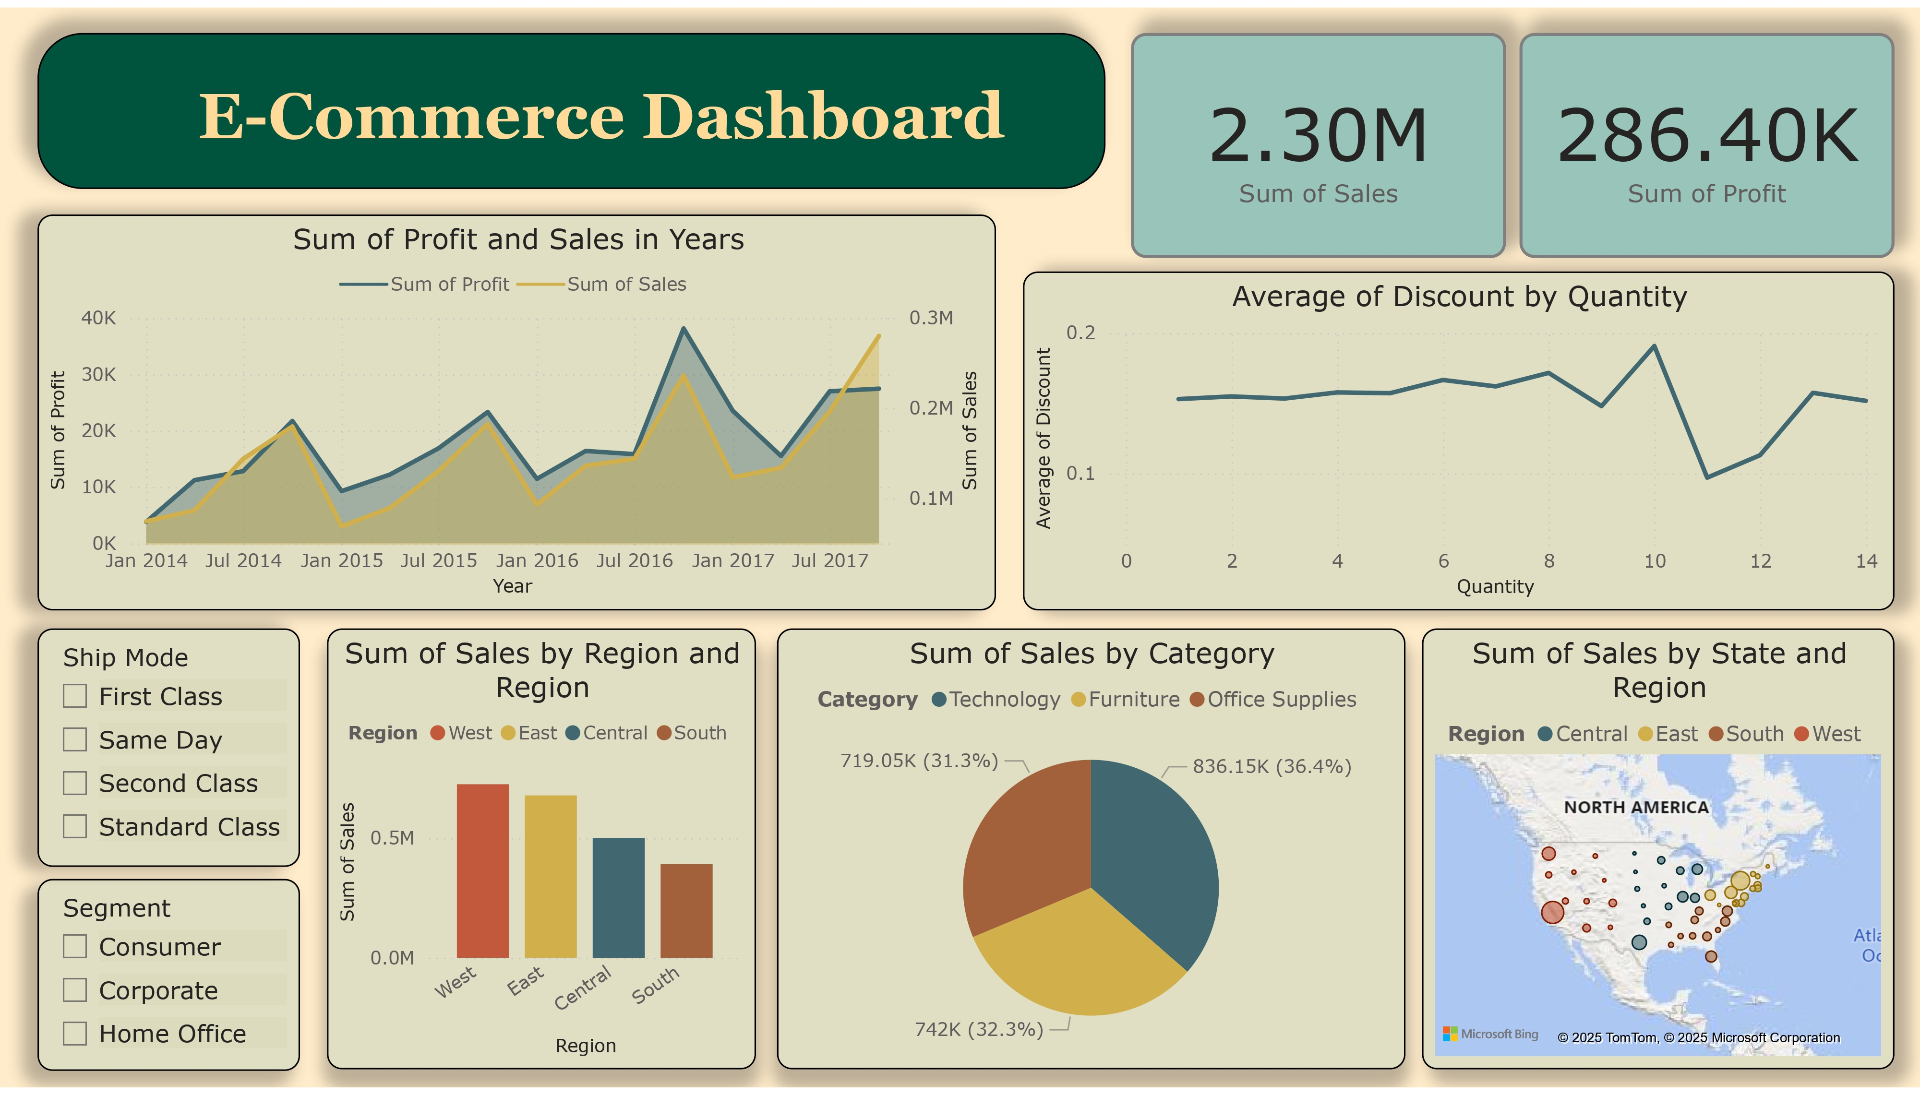
I turn your data into a visual report you can use in presentations or decisions. I create a visual report that shows patterns, trends and comparisons. I use Matplotlib and Seaborn. I include simple insights and short explanations. You get the notebook, the images and a PDF version. This works well for presentations, assignments and internal planning.
الموقع
عن بعد
طريقة الدفع
محفظة
علامات البحث
powerbi
dashboards
تحليل بيانات
reports
الاساسية
A visual report in PDF or image format, the source notebook and brief written insights.
1 أيام التسليم
50شارك هذه الخدمة
تعجبك !، قم بمشاركها