Data Professional Survey Breakdown Using Excel & Power BI
تفاصيل العمل
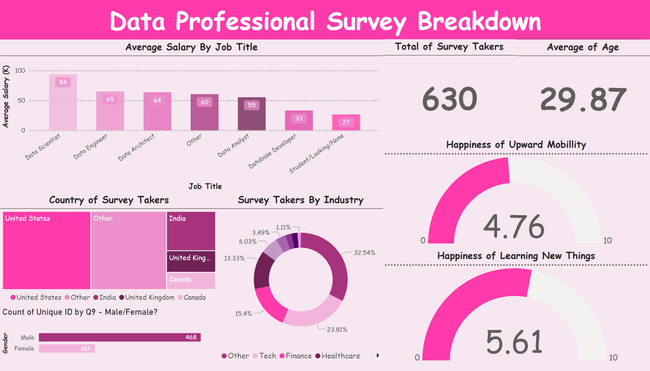
This dashboard was created using Power BI to analyze survey responses from individuals in the data professional industry. The primary dataset used was an Excel sheet consisting of responses from 630 participants, providing insights into various aspects of their career profiles and job satisfaction. Key Insights and Visuals: Average Salary by Job Title: The top visual compares the average salaries across several key roles in the data industry. Data Scientists lead with an average salary of $94K, followed by Data Engineers ($65K), Data Architects ($64K), and other notable roles such as Database Developers, Data Analysts, and students looking for opportunities. Demographics: The total number of survey participants was 630, with an average age of 29.87 years. A breakdown by Country of Survey Takers shows that the majority of respondents are from the United States, with significant participation from India and the United Kingdom. Gender Representation: The analysis includes a Count of Unique IDs by Gender, highlighting that 468 of the respondents identified as male and 162 as female, reflecting the gender distribution in the data professional field. Industry Representation: A Survey Takers by Industry donut chart shows that 32.54% of respondents work in Tech, followed by Finance (23.81%), Healthcare (15.46%), and others, reflecting the diverse sectors where data professionals are employed. Job Satisfaction: Happiness of Upward Mobility and Happiness of Learning New Things are evaluated on a scale of 0 to 10. The average scores are 4.76 for upward mobility and 5.61 for learning opportunities, reflecting moderate satisfaction levels among respondents in these areas. Tools and Technologies: Power BI: Used for data visualization and dashboard creation. Excel: Served as the primary data source containing the survey responses. Survey Analysis: Focused on understanding compensation trends, demographics, job satisfaction, and industry distribution. This dashboard provided valuable insights into the landscape of data professionals, helping employers and professionals alike understand key trends in salaries, satisfaction, and demographics in the industry. Note: Color selection by customer
المهارات المستخدمة
تعليقات
لم يتم ترك أي تعليق حتى الأن
تعجبك !، قم بمشاركها